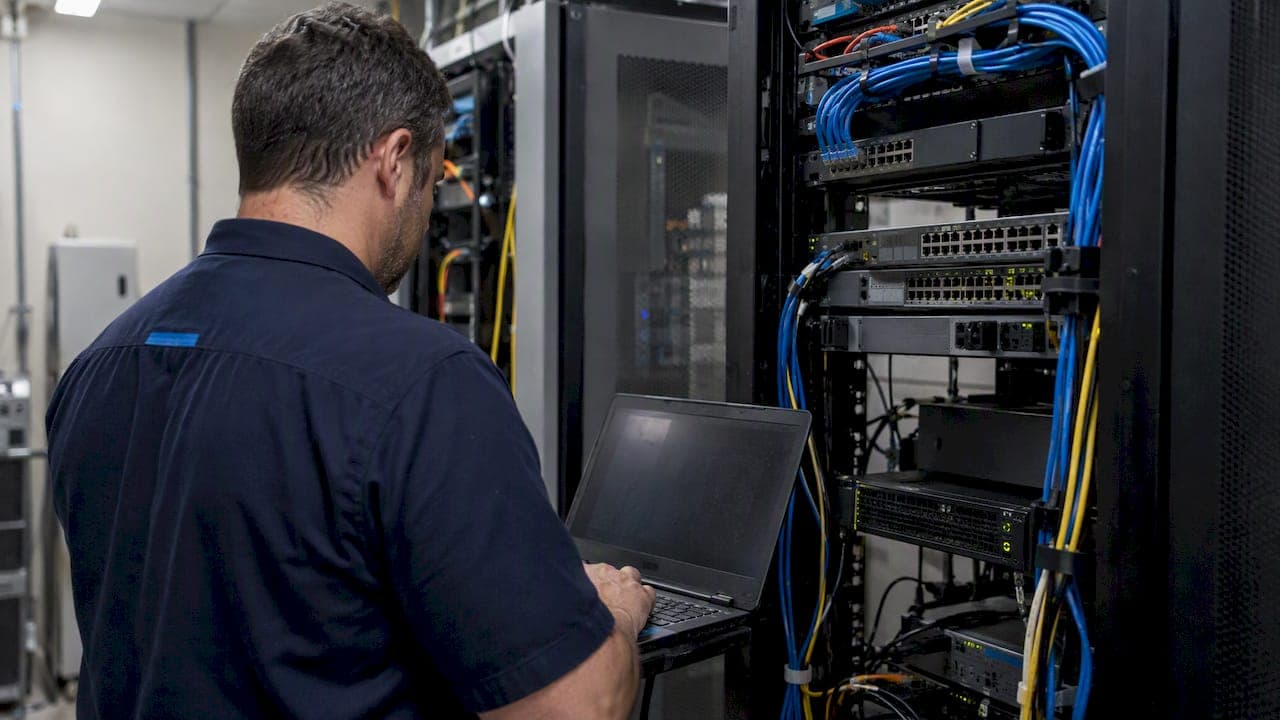
The correct immediate action during a network outage is to preserve volatile evidence before attempting fixes, then run a structured root cause analysis that layers timeline reconstruction on top of that evidence. Within the first minutes, capture running configurations and routing state, volatile logs and process state, and a short packet capture or flow snapshot. These three artifacts disappear fast, and once they're gone, the true cause often goes with them.
TL;DR:
- Name one evidence owner, save captures outside the affected network, and postpone reboots or interface resets until collection is complete.
- Group alerts by topology, timing, and affected service, then check recent changes and determine whether the fault spans independent paths.
- Centralize syslog in an out of band SIEM, pair passive flow collection with targeted packet captures, and use active probes only to test chosen paths.
- Causal models can help large networks, but teams should establish reliable telemetry and repeatable traces before adding automated inference.
- Cloudflare’s 2025 resolver outage followed a dormant configuration error exposed by a later refresh; tighter validation of routing changes closed the prevention gap.
Table of Contents
- What Network Outage Root Cause Analysis Actually Means
- Symptoms vs. Root Cause: Triage Rules to Stop Chasing Noise
- Step-by-Step RCA Process: Evidence Capture, Hypothesis Testing, and Reporting
- Telemetry and Tools That Scale: What to Collect and When to Use Model-Based Methods
- A Postmortem Example: Tracing a Configuration Change to a Global Outage
- How Proactive Monitoring Changes RCA Outcomes
- Three Moves Worth Making This Week
- How We Help with RCA, 24/7 Monitoring, and Post-Incident Fixes
- FAQ
- Sources
What Network Outage Root Cause Analysis Actually Means
Root cause analysis for a network outage is the process of identifying what triggered the disruption, reconstructing the sequence of events, and defining corrective actions that prevent a repeat. NIST SP 800-61r3 frames this as determining the sequence of events, the assets and vulnerabilities involved, and any systemic causes, then feeding those findings back into governance so the same gap doesn't reopen.
Most enterprise outages trace back to a short list of recurring causes:
- Configuration changes: a routing policy, ACL, or firmware push applied without full validation.
- Hardware or line card failure: a failing optic, power supply, or backplane component.
- Routing and BGP events: route withdrawals, leaks, or flapping sessions that ripple downstream.
- Congestion and capacity limits: traffic spikes that exceed buffer or link capacity.
- Third-party or vendor issues: an upstream provider outage or a compromised vendor integration.
A working RCA separates the primary cause from the secondary symptoms it produces. A flood of interface-down alerts is usually a symptom of one upstream fault, not five separate failures, and a realistic RCA sets out to name that one fault, not to explain every alert individually.
Symptoms vs. Root Cause: Triage Rules to Stop Chasing Noise
A single upstream fault routinely generates dozens of downstream alerts, and treating each one as an independent problem wastes the early minutes when evidence is most intact. Recognizing that pattern, sometimes called an alert storm, is the first triage skill worth building.
- Group alerts by topology, timestamp, and affected service to find the common upstream point.
- Check for recent changes: deployments, firmware updates, or configuration pushes in the hours before the first alert.
- Capture device counters, CPU and memory utilization, and process state on the suspected device before touching it.
- Confirm whether the issue is isolated to one path or segment, or whether it spans multiple independent systems.
The instinct to restart a device or clear a session the moment service degrades is understandable, but it is often the single action that erases the evidence an RCA depends on. The Cisco Learning Network notes that premature restoration steps like reboots routinely destroy volatile data that would otherwise have produced a conclusive root cause, and recommends having a lightweight capture template ready before anyone touches a device.
Pro Tip: Pause any reboot or interface reset on the suspected device until someone has pulled its running config, logs, and a short packet capture, even if that delay is only two or three minutes.
Step-by-Step RCA Process: Evidence Capture, Hypothesis Testing, and Reporting
A focused RCA process runs in three phases, and the first phase matters most because it only happens once.
Immediate capture. Assign one person as evidence owner before anyone starts troubleshooting. That person pulls:
- Running configuration and
show techoutput from affected devices. - Current routing and BGP tables.
- A short packet capture or NetFlow/IPFIX export from the affected path.
- Interface counters, CPU, memory, and process state.
Store all of it outside the affected device, ideally in an out-of-band SIEM or secure storage that survives even if the primary network goes down.
Hypothesis formation and testing. Reconstruct a timeline from the captured logs and correlate it against the change calendar. Map each symptom to its position in the topology, then test candidate causes using traceroutes, BGP table diffs, interface counter trends, and flow analysis. A route that disappeared from the table at the same second a config push completed is a strong signal; a CPU spike that predates the first alert by several minutes points to resource exhaustion rather than an external trigger.
Reporting and remediation. A usable RCA report includes the impact (services and users affected), a timeline, the confirmed root cause, the scope of systems involved, the remediation applied, and any monitoring changes made as a result. CISA's guidance on communicating under pressure recommends leading with a bottom-line-upfront summary and sharing lessons learned quickly, both internally and with affected stakeholders, to reduce the chance of a repeat incident elsewhere. Each remediation item should convert into a change-control ticket, not stay as a note in the postmortem doc.
Telemetry and Tools That Scale: What to Collect and When to Use Model-Based Methods
A dependable RCA practice rests on a consistent telemetry stack rather than on tooling assembled during the incident itself. The essentials are:
- Syslog from every network device, centralized rather than left local.
- SNMP and interface counters for utilization, errors, and drops.
- NetFlow or IPFIX for traffic pattern and path visibility.
- Packet captures at key chokepoints for protocol-level detail.
- BGP route collectors for external routing visibility.
- Controller or SDN state where the environment is software-defined.
- A SIEM that aggregates all of the above in one searchable place.
Active probes are useful for confirming reachability along a specific path but only test what you point them at. Passive flow telemetry covers more ground with less overhead but gives less protocol detail than a packet capture. In-band network telemetry adds per-hop timing data on programmable switches, but most enterprise networks don't run that hardware, so passive flow collection paired with targeted packet captures remains the practical baseline.
Model-based and causal-graph approaches can sharpen RCA in large networks. Evaluated methods have shown high accuracy in identifying root causes in labeled test sets. (arXiv) These methods add real value once telemetry coverage and signal quality are already solid. Teams without that foundation get more from reproducible traces and topology-aware correlation first, then layer in automated inference once the basics are consistently captured.
A Postmortem Example: Tracing a Configuration Change to a Global Outage
A useful way to see RCA in practice is the pattern behind Cloudflare's July 2025 1.1.1.1 outage. The resolver service became unreachable across multiple regions, and the first alerts pointed in several directions at once, which is typical of a cascading failure.
- Timeline reconstruction traced the disruption to an internal configuration error introduced earlier and left dormant.
- A later configuration refresh exposed the dormant error, triggering the route withdrawal that caused the outage.
- The determination relied on correlating change records against the exact timestamp routes disappeared, beyond service logs.
The fix addressed the immediate misconfiguration, and the preventive action that followed was tighter validation on configuration changes that touch routing state, closing the gap that let the earlier error go unnoticed for as long as it did.
How Proactive Monitoring Changes RCA Outcomes
A proactive, 24/7 monitoring posture changes what's available when an outage happens: evidence is already centralized, playbooks already define who captures what, and compliance handling (HIPAA, GDPR) is built into log retention from the start. That's a model some proactive IT management teams run.

RCA findings map directly into service work: alert thresholds get tuned, evidence capture gets faster, patching cadence tightens, and backup and disaster recovery plans get updated to reflect what the incident revealed. For teams building out their own capture process, our log retention guidance and incident response plan guide cover the planning work in more detail.
Three Moves Worth Making This Week
Most teams already have the skills to run a good RCA. What they're missing is preparation before the next outage starts.
- Write a one-page RCA capture checklist now, before you need it under pressure.
- Centralize logs into an out-of-band SIEM so a local failure doesn't erase your evidence, a point CISA's incident response lessons backs directly.
- Add one flow export or probe on your most critical path if you don't already have one there.
The habit that costs teams the most is reaching for a reboot before anyone has pulled volatile state. Fix that order first.
— Alex
How We Help with RCA, 24/7 Monitoring, and Post-Incident Fixes
Managed monitoring, incident response, and backup and disaster recovery help for small to mid-size businesses can include flat-rate billing and no long-term contract. When an outage hits, our team captures evidence, runs the RCA, and turns findings into concrete remediation instead of a one-time patch.
If you want a second set of eyes on your last incident or ongoing monitoring that catches the next one earlier, reach out through our managed IT services page to set up a post-incident assessment.
FAQ
What is root cause analysis in networking?
Root cause analysis in networking is the process of identifying the specific event, misconfiguration, or failure that caused a network disruption, then documenting the timeline and corrective actions. NIST SP 800-61r3 frames it as determining the sequence of events and systemic causes so the gap can be closed.
What are the common causes of network outages?
Common causes include configuration changes applied without full validation, hardware or line card failures, BGP route withdrawals or leaks, congestion that exceeds link capacity, and third-party or vendor-side disruptions. Public postmortems repeatedly point to internal configuration errors and capacity issues as more frequent causes than external attacks.
What caused the global internet outage?
Large-scale outages have different individual causes, but a well-documented example is Cloudflare's July 2025 1.1.1.1 incident, where a dormant internal configuration error was exposed by a later, unrelated configuration refresh. Timeline reconstruction against change records is usually what reveals this kind of dormant cause.
What is the most common cause of network failure?
There's no single universal cause, but configuration errors and capacity or congestion issues show up repeatedly across public postmortems as leading contributors to large outages. Distinguishing a configuration-driven route withdrawal from an external hijack requires checking BGP origin data and correlating it against the exact outage timeline.
Sources
- Communicating under pressure: best practices for service providers — CISA
- Computer Security Incident Handling Guide (NIST SP 800-61r3)
- Cloudflare 1.1.1.1 incident postmortem (July 14, 2025)
- The dilemma of service restoration vs. root cause analysis — Cisco Learning Network