
24/7 network monitoring provides continuous telemetry and alerting so teams detect outages and security incidents fast and minimize downtime. It works by collecting data from devices, traffic flows, and logs around the clock, then routing anomalies through automated alerts and escalation paths. The result is earlier detection, faster remediation, and fewer surprises during business hours or after them.
TL;DR:
- Track device health, latency, packet loss, bandwidth, authentication events, and intrusion alerts; reserve packet capture for critical segments and intermittent faults.
- Run passive monitoring for one to two weeks before setting thresholds, then tune alerts against normal traffic to reduce false positives without hiding anomalies.
- Keep full packet captures for only one to two weeks on critical segments, while retaining aggregated metrics and indexed logs longer for trends and compliance.
- Build in house only when your team can staff nights and weekends or monitoring gives you a competitive edge; otherwise, managed coverage avoids new hires.
Table of Contents
- What does 24/7 network monitoring actually watch?
- Why continuous monitoring pays off for IT teams and leadership
- How 24/7 monitoring works: architecture and response flow
- How to evaluate and choose a 24/7 monitoring approach or provider
- Implementation checklist and rollout timeline
- Secure Techies: an operational example of 24/7 monitoring in practice
- Should you outsource 24/7 monitoring or build it in-house?
- Get 24/7 monitoring running without adding headcount
- FAQ
- Sources
What does 24/7 network monitoring actually watch?
Continuous monitoring pulls from several data sources at once, and each one catches a different category of problem. Device and host metrics, such as CPU load, memory usage, disk space, and interface status, flag hardware strain before it causes an outage. Network metrics like latency, packet loss, and bandwidth utilization reveal congestion or failing links, often alongside flow telemetry that shows which applications or destinations are consuming capacity.
Security signals round out the picture: intrusion detection and prevention (IDS/IPS) alerts, syslog entries, and authentication events help teams spot credential misuse or lateral movement before it becomes a breach. For deeper troubleshooting, packet capture and deep packet inspection reveal issues that simple counters miss, including failed handshakes and retransmissions that point to a flaky connection rather than a dead one, a distinction confirmed in packet-level analysis research.
- Device health: CPU, memory, disk, and interface counters that predict hardware failure.
- Network performance: latency, packet loss, and bandwidth trends across links.
- Security events: IDS/IPS alerts, authentication logs, and syslog anomalies.
- Packet-level detail: used selectively on critical segments to diagnose intermittent faults.
Why continuous monitoring pays off for IT teams and leadership
The case for round-the-clock visibility rests on a simple trade: catching problems in minutes instead of hours. Faster detection shortens mean time to resolution (MTTR) and cuts the number of outages that escalate into full incidents. For regulated organizations, monitoring also produces the audit trail and evidence collection that frameworks like HIPAA require, since HHS guidance on HIPAA for professionals ties logging and incident response directly to compliance obligations.
Pricing for monitoring tools varies widely by model, with entry-tier platforms often available at no cost and top-tier products reaching median list prices in the higher hundreds to low thousands of dollars, according to network monitoring pricing benchmarks. That spread reflects differences in per-device, per-sensor, and usage-based billing, which matters when you are comparing proposals.
Beyond cost control, continuous monitoring supports capacity planning, since trend data shows when a link or server is approaching its limit well before users notice. Track a small set of indicators: uptime percentage, MTTR, and alert volume per week, to know whether your monitoring investment is actually working.

How 24/7 monitoring works: architecture and response flow
A working monitoring setup has four layers, and understanding each one helps you evaluate tools or providers with clear eyes.
Collection starts with agents installed on servers and endpoints, SNMP polling for network devices, NetFlow or IPFIX for traffic visibility, cloud APIs for hosted infrastructure, and synthetic probes that simulate user transactions to catch issues before real users do.
Analysis happens centrally: metrics flow into a time-series store, logs get indexed for search, and correlation rules tie related events together so a single root cause does not generate a dozen separate alerts. Dashboards give on-call staff a real-time view without digging through raw data.
Retention decisions balance cost against forensic value. Raw packet captures are expensive to store at scale, so many teams keep full packet data for short windows, often one to two weeks, on critical segments only, while aggregated metrics and indexed logs stay available for longer-term trend analysis and compliance reporting.
Alerting and escalation turn detection into action. This means documented runbooks, integration with a ticketing system, and defined on-call schedules so an alert at 2 a.m. reaches someone who can act on it. Mature setups add automation and playbooks that handle routine remediation, like restarting a stalled service, without waiting for a human.
- Collectors: agents, SNMP, flow telemetry, cloud APIs, synthetic checks.
- Analysis layer: metrics storage, log indexing, correlation, dashboards.
- Response layer: runbooks, ticketing integration, on-call rotation, automated remediation.
Pro Tip: Tune alert thresholds during a two-week baseline period before going live, so your team isn't drowning in false positives on day one.
How to evaluate and choose a 24/7 monitoring approach or provider
Choosing between a managed service, an in-house tool plus staff, or a hybrid model comes down to six practical questions.
- Coverage: Confirm the approach covers your full asset scope, including cloud workloads, on-premises hardware, and the specific device types you run.
- Alert quality and SLAs: Ask for a defined mean time to notify and a documented escalation path so you know exactly when and how you'll be contacted.
- Response model: Decide whether you need a NOC for performance monitoring, a SOC for security operations, or hands-on remediation versus alert-only service.
- Compliance and reporting: Verify the provider can produce audit-ready evidence and reporting aligned to frameworks like HIPAA if you operate in a regulated industry.
- Pricing model: Compare per-device, per-sensor, and usage-based pricing structures against your asset count to find predictable, scalable billing.
- Integration needs: Check compatibility with your existing ticketing system, CMDB, identity provider, and any automation platforms already in place.
NIST's continuous monitoring guidance frames this evaluation as choosing a program, not just a tool: the strategy, measurement cadence, and governance around monitoring matter as much as the technology itself. Pairing network telemetry with endpoint detection and response, as described in this overview of EDR, closes a common gap between network-level alerts and what's happening on individual devices.
Implementation checklist and rollout timeline
Deploying continuous monitoring works best as a phased rollout rather than a single cutover.
- Discovery and inventory: Map every device, application, and cloud resource, then rank them by business criticality.
- Pilot deployment: Start with your most critical assets, servers, core switches, and customer-facing applications, before expanding coverage.
- Baseline collection: Run monitoring passively for one to two weeks to establish normal performance ranges before setting alert thresholds.
- Threshold tuning: Adjust alert rules based on baseline data to cut noise while keeping genuine anomalies visible.
- Phased collector rollout: Extend agents, SNMP polling, and flow telemetry to remaining assets in planned waves, integrating with your ticketing system as you go.
- Runbook creation and drills: Document response steps for common alerts and test escalation paths with a tabletop incident drill.
- Measure and iterate: Track MTTR, alert volume, and uptime monthly, then refine thresholds and runbooks based on what you learn.
A network vulnerability assessment is a useful companion step during discovery, since it surfaces weaknesses that monitoring alone won't catch until they're already being exploited.
Pro Tip: Run your first incident drill within 30 days of going live. It's the fastest way to find gaps in your escalation chain before a real outage does.
Secure Techies: an operational example of 24/7 monitoring in practice
We run managed 24/7 monitoring as a core part of our managed IT services, built on the same layered approach outlined above: continuous telemetry collection, tuned alerting, and a defined escalation path to our team rather than an unmonitored dashboard.
In practice, this approach helps catch failing hardware and unusual authentication activity before they turn into outages or security incidents, enabling prompt response rather than waiting for a client to notice something was wrong. For a closer look at why round-the-clock coverage changes response times, see our breakdown of 24/7 IT support. The checklist above, discovery, baselining, phased rollout, and drills, outlines a typical process for bringing new clients onto monitoring: critical assets first, tuned alerts second, full coverage last.
Should you outsource 24/7 monitoring or build it in-house?
Building monitoring in-house makes sense when your team has the staffing to cover nights and weekends and wants deep customization tied to a unique environment. For most small and mid-size organizations, though, the math favors a managed approach: faster time to value, immediate access to tuned alerting and 24/7 coverage, and a faster path to compliance evidence without hiring a dedicated NOC. In-house build is a real differentiator only when monitoring itself is part of your competitive edge, not when it's infrastructure overhead.
— Alex
Get 24/7 monitoring running without adding headcount
24/7 network monitoring is often handled as part of a broader managed IT relationship, combining proactive monitoring with network security, managed help desk support, and compliance audits to provide comprehensive coverage. 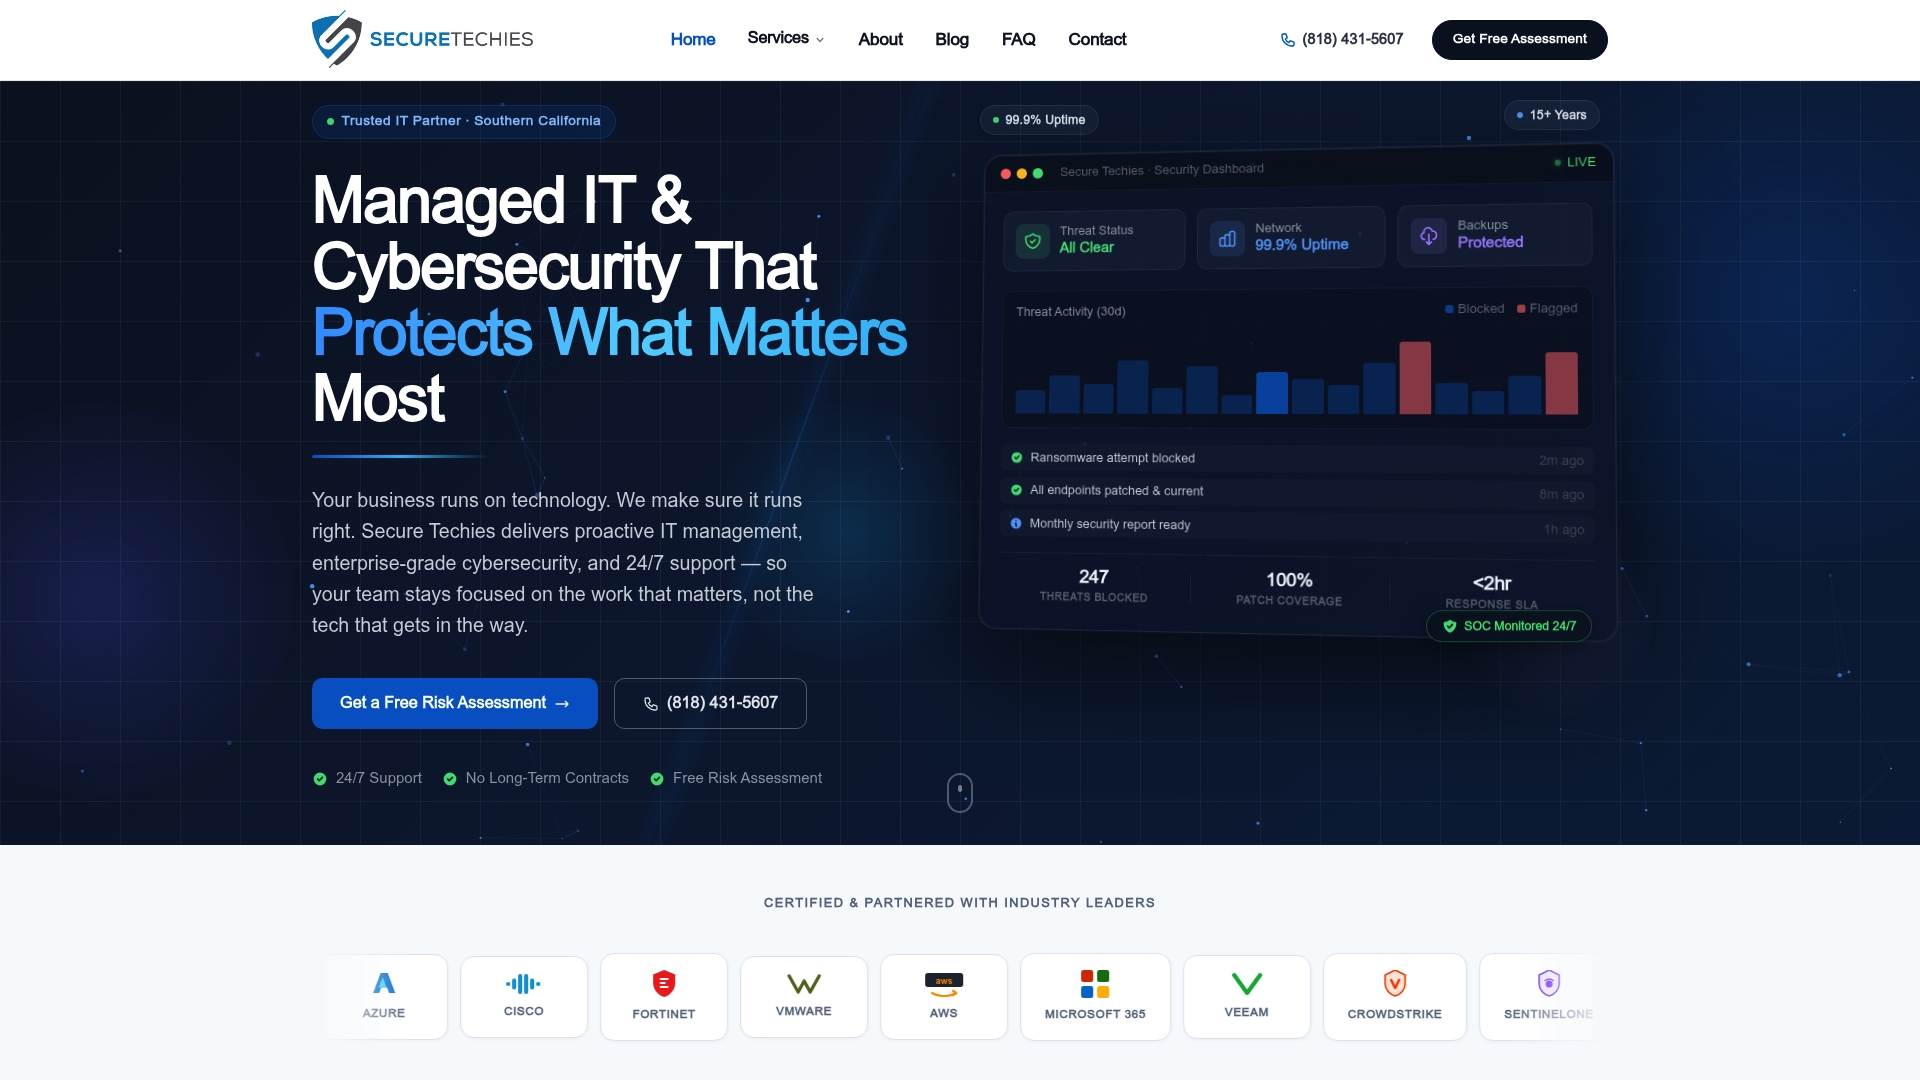
A typical engagement begins with an assessment of the current environment, mapping critical assets, and building a tailored monitoring and response plan with clearly defined SLA expectations rather than a generic package. Deployment generally follows the phased approach described above: critical systems first, tuning second, and full coverage after thresholds are dialed in.
If you're ready to stop finding out about outages from your customers, visit our managed IT services page or explore our network security solutions to see how monitoring fits into a full security and compliance program.
FAQ
What are network security monitoring tools?
Network security monitoring tools collect and analyze traffic, logs, and device data to detect intrusions, policy violations, and anomalies in real time. Common categories include IDS/IPS systems, SIEM platforms for log correlation, and flow analyzers that track traffic patterns across the network.
How do I know if my PC is being monitored?
Authorized monitoring on a managed network typically runs through an installed agent, which usually appears in your system's running processes or installed applications list. If you're unsure whether your device is part of a company's monitoring program, your IT administrator or help desk is the most reliable source for a direct answer.
What are some popular cloud monitoring tools?
Cloud monitoring typically relies on native platform tools for metrics and logs, paired with third-party platforms that aggregate data across multiple cloud providers. Choosing between them depends on whether you need single-cloud depth or multi-cloud visibility, along with how the pricing model fits your infrastructure size, as pricing structures vary significantly across monitoring platforms.
Is there a free network sniffer available?
Yes, Wireshark is a widely used, free packet analysis tool that captures and inspects traffic at the packet level. It's commonly used for troubleshooting performance issues and security investigations that require more detail than standard metric dashboards provide.
What does continuous monitoring mean under NIST guidance?
Under NIST SP 800-137, continuous monitoring (ISCM) means maintaining ongoing awareness of security posture, vulnerabilities, and threats to support risk management decisions over time. It's treated as an organizational program involving governance and measurement, not just a monitoring tool running in the background.
Sources
- NIST Special Publication 800-137: Information Security Continuous Monitoring (ISCM) for Federal Information Systems and Organizations
- Packet-level analysis technical reference (academic paper)
- HHS: HIPAA for professionals
- Wireshark documentation (technical reference)